Mandelbrot Set - 06/09/19
Back to Main PageI decided that I should learn a little about code optimisation in python, not by writing better code, but by using special libraries, and hopefully use my GPU a little more.
I thought that a good way to do this would be to make something that involves a lot of calculations. I had seen several of the "Mandelbrot Zoom" videos on youtube, and they had piqued my interest.
To get an idea of the background of the Mandelbrot set, and how it is calculated, I started out by watching this numberphile video:
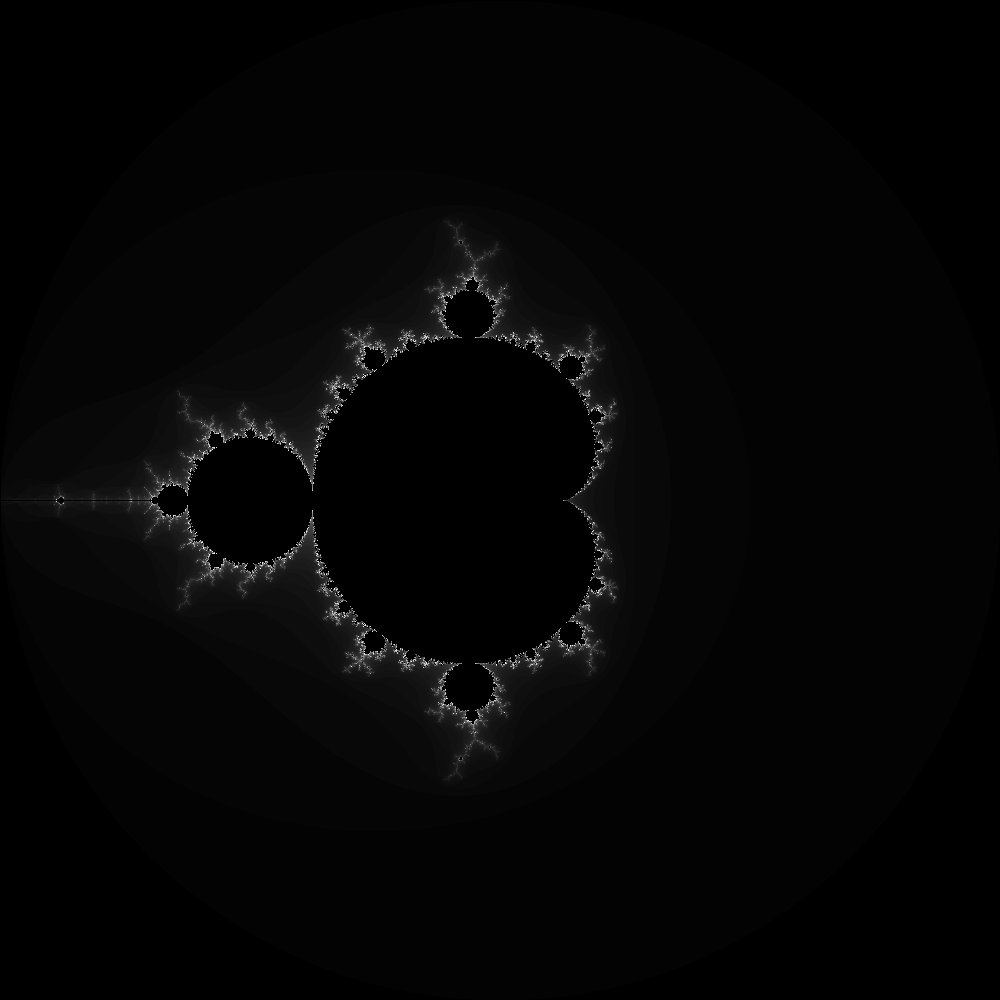
This gave me everything I needed to know to start coding. I used PIL to create a blank canvas, and performed the iterative calculation on every pixel, setting the brightness of that pixel to be Iterations * 255 / MaxIterations
This resulted in some nice pictures, such as this:
This code work fine, but it was rather slow, especially on larger images with more iterations per pixel, so I looked into optimising it. Through some googling, I found the Numba library for python. This allowed me to compile code on the fly, which resulted in a massive speed boost.
After adding in a system to colour the images properly, I got results like these:

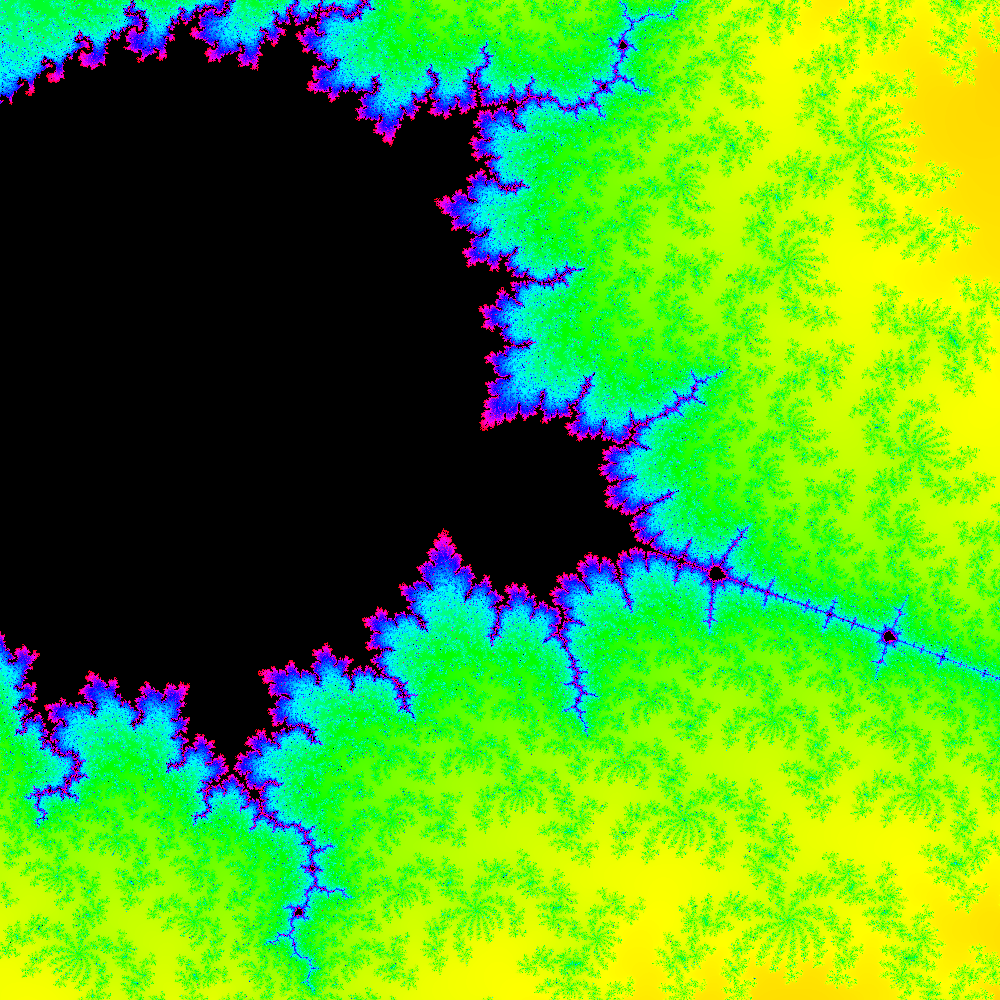
Both of these are actually the same point on the imaginary plane (0.05077556351072351 -0.6540272433939155i), except the second is much more zoomed in than the first.
I realised a while afterwards that I hadn't actually use the GPU at all, I was simply optimising it for my CPU, so there are still some things I have to learn.
The code can be downloaded here, and you will need PIL, Numba and Numpy to run it.